

Tier 2 monitoring system
The Tier 2 monitoring system uses remote sensing data such as satellite imagery and aerial photography to monitor changes in land condition over time.
Permanent field sites provide ground-based data that is used to verify information derived from interpretation of the remote sensing data.
Objectives
The objectives for the Tier 2 monitoring include reporting on the condition of pastoral land
The Tier 2 monitoring program provides scientific data on the trend and condition of pastoral lands at a regional scale (eg: Pastoral District). This information allows the Pastoral Land Board to report on and make recommendations relating to the condition of pastoral lands to the Minister for Environment and Natural Resources with the ultimate aim of achieving sustainable land use.
- regional monitoring and condition assessment of all land resources in the Northern Territory.
Systems using remotely sensed data such as satellite imagery with monitoring sites and ground-truthing to report on land cover change over all lands in the Territory are currently being developed by the Department of Environment and Natural Resources. Current rangeland monitoring techniques are being extended to all pastoral land in the Northern Territory and the use of comparable methods for determining rates of tree clearance and monitoring wetland, mangrove and coastal environments has commenced. This information will contribute to State of the Environment reporting in the Northern Territory.
- establishing a land resource monitoring database.
Objective detailed scientific information on range condition at permanent sites augments interpretation of remotely sensed data and provides a basis for interpreting change. The Tier 2 database forms a benchmark for future monitoring and research and as the basis for understanding long-term change.
- establishment of Tier 2 sites to provide the following data:
- a photographic record
- vegetation abundance and species list
- soil and landform attributes
- landscape function analysis
- estimates of pasture utilisation and fire frequency.
Establishment in the tropical savannas
Tier 2 monitoring activity has focused on the pastorally productive Victoria River District with recent application in the Sturt Plateau Region.
Landscape Cover Change Analysis (LCCA) was developed over a period of five years from 1994 to 1999 where relationships between ground-based sites and time-series Landsat data were established.
A total of 69 Tier 2 ground based sites have been installed on seven leases in the Victoria River District (VRD) and a further 24 sites installed on six leases in the adjacent Sturt Plateau region in 2000.
Regional land condition assessment over a four-scene Landsat mosaic covering 66,550 square kilometres was completed as part of the National Land and Water Resources Audit (Karfs et al. 2000).
A monitoring database established for the VRD is now operational and will be included within the NT Government Natural Resource Information Management Environment (NRIME). The VRD database is the prototype for Tier 2 monitoring information though modifications are anticipated in other regions of the NT due to climatic and environmental differences.
Tropical savannas
Landscape Cover Change Analysis (LCCA) involves the integration of time-series Landsat satellite data with ground monitoring, land resource and infrastructure spatial datasets.
Detailed information of on-ground measurements is enhanced by the extrapolative capacity of remote sensing. Both ground sites and satellite imagery have a specific purpose and compliment the others limitations.
Ground sites provide a detailed measure of on-ground processes and a description of what occurs at that point in the landscape.
This data is useful for understanding the ecology of the landscape, describing the biodiversity, and interpreting time-series satellite imagery.
Also long-term field studies will explain seasonal trends or disturbance-induced changes.However, site data is limited in its capacity for extrapolation, which is where the remote sensing comes to the fore.
The advantage of satellite imagery is its ability to assess cover over broad scales. Landsat MSS and TM data are used for mapping differing responses associated with land condition.
Time trends based on historical satellite information are produced and validated with the ground site data. The imagery is acquired in the late dry season, when most of the vegetation cover is senescent.
Site size and layout
The sites are 100m x 100m (1 hectare) square, except for the first 14 Tier 2 monitoring sites established on Victoria River Downs (150m x 150m).
This smaller size increases efficiency during assessment of the site, such as reduced distance to walk and ease of location of corner pickets.100m is equal to the standard tape size and transect length for Landscape Function Analysis (LFA).
All sites are orientated down slope between pickets 1 to 2 and pickets 3 to 4. A theodolite is used to determine the maximum slope and survey in the permanent corner pickets and centre picket.
Site pickets are labelled with aluminium tags on which site information and picket number are stamped.
Each picket is painted white with the top 30cm sprayed red to assist in relocating the pickets.
An additional roadside picket (or several fence line pickets) are similarly painted and labelled to facilitate relocating the site along the road and remind managers and station workers of the site location.
Roadside pickets are labelled with a tag containing the site distance and direction from the road. Additional information useful for relocation is distance from nearest landmark and direction, which is recorded on site sheets and in the database for later reference.
Site photography
For a Tier 2 Monitoring site the photo is taken at 180 degrees, to have the sun shining on the vegetation and behind the lens.
The photographer stands on a 1.2m ladder behind the centre picket, looking away from the permanent centre picket toward a temporary picket 10m away.
A white board with site number and date is hung on the temporary picket. The temporary photo picket is used because cattle have been known to selectively graze and trample the grass around permanent pickets leaving a disturbed or bare patch.
Southern region of the NT
Currently, the southern region of the NT is being monitored using a different technique.
Remote-sensing-based-monitoring (RSBM), by its nature, identifies areas with the highest potential for land degradation. Basic processing and analysis of satellite imagery can indicate sites requiring either amelioration or at least on-ground assessment.
The cattle management features that are most readily observed on the satellite imagery are of two types:
- numerous, wide cattle pads radiating from watering points
- inter-paddock differences in grazing pressure - sometimes both overlap.
An example of cattle pads radiating from a bore as seen in a Landsat image.
An inter-paddock fence difference, shown in the processed Landsat image above: bare ground in red, fresh vegetation in green and old vegetation in blue.
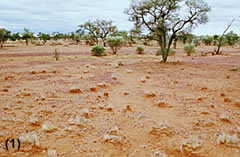
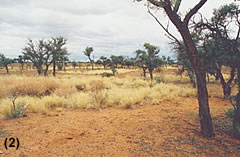
The same inter-paddock difference corresponding to the red versus blue difference in the processed Landsat image above but seen on the ground. On the left (1), grass and pedestalling of individual grass clumps due to erosion, and on the right (2), older grass and soil surface intact.
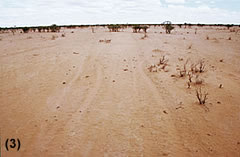
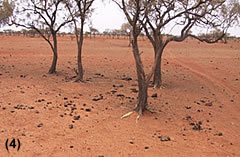
Closer to the bore bare topsoil is seen on imagery as highly reflective areas (usually white) and in these areas erosion is usually even more severe, e.g. loss of topsoil. In the photograph above left (3) 1km away from the watering point – sand drifts across adjacent cattle pads: and right (4) 500m away from the watering point – tree roots are bared by loss of topsoil.
More quantitative processing of imagery can reveal the spatial extent and degree of loss in vegetative biomass, compared with surrounding areas. Sometimes however the change in fresh vegetation in degraded areas is the reverse of that expected, therefore a range of environmental factors must be considered during analysis of the quantitative results.
The grazing gradient graphs below show soil bareness as a function of distance from water of two different degraded areas. The information was retrieved from processed Landsat imagery and ASTER imagery using Geographic Information System (GIS) computer software.
 with increasing distance from water")
")
The one on the left has decreasing bareness (with increasing vegetation) with increasing distance from water, and the one on the right has increasing bareness (with decreasing vegetation).
The gradient in the graph on the left was due to more senescent (old) grass being consumed closer to the bore.
The gradient in the graph on the right was because rain caused abundant fresh grass growth on bare ground closer to the bore. A mixture of gradients can appear on one graph, thus making a quantitative value of degradation impossible.
There are limits to the applicability of RSBM because:
- satellite imagery shows indicators of erosion, e.g. riparian erosion, but not the erosion itself
- a high contrast between degraded and non-degraded areas is needed, either spatially or temporarily. Degraded areas with natural looking patterns are difficult to discern spatially
- imagery does not highlight historically heavily-grazed piospheres, which have been lightly grazed in recent decades, but nevertheless have a degraded seedbank
- older imagery is frequently used and management patterns may have since changed. This especially influences observations relating to inter-paddock differences
- flora biodiversity can not be assessed without using hyper-spectral imagery and investing in on-ground work to acquire a spectral library (which is very expensive).
Give feedback about this page.
Share this page:
URL copied!